
Tropical Storm Khanun Headed Towards Korea. Is its Erratic Path the Result of Climate Change?
Last week, we tracked Typhoon Khanun as it meandered near the Okinawa and Amami regions of southern Japan as a powerful typhoon. After passing by the islands with strong winds – enough to knock out power to about 30% of Okinawa – Khanun made a U-turn back towards the island groups while weakening to a tropical storm [1]. Despite its weakened state, however, its slow forward motion meant that impacts related to torrential rainfall and flooding were ongoing for several days [2]. Now Khanun, still a tropical storm, has its eyes set on another nation: South Korea.
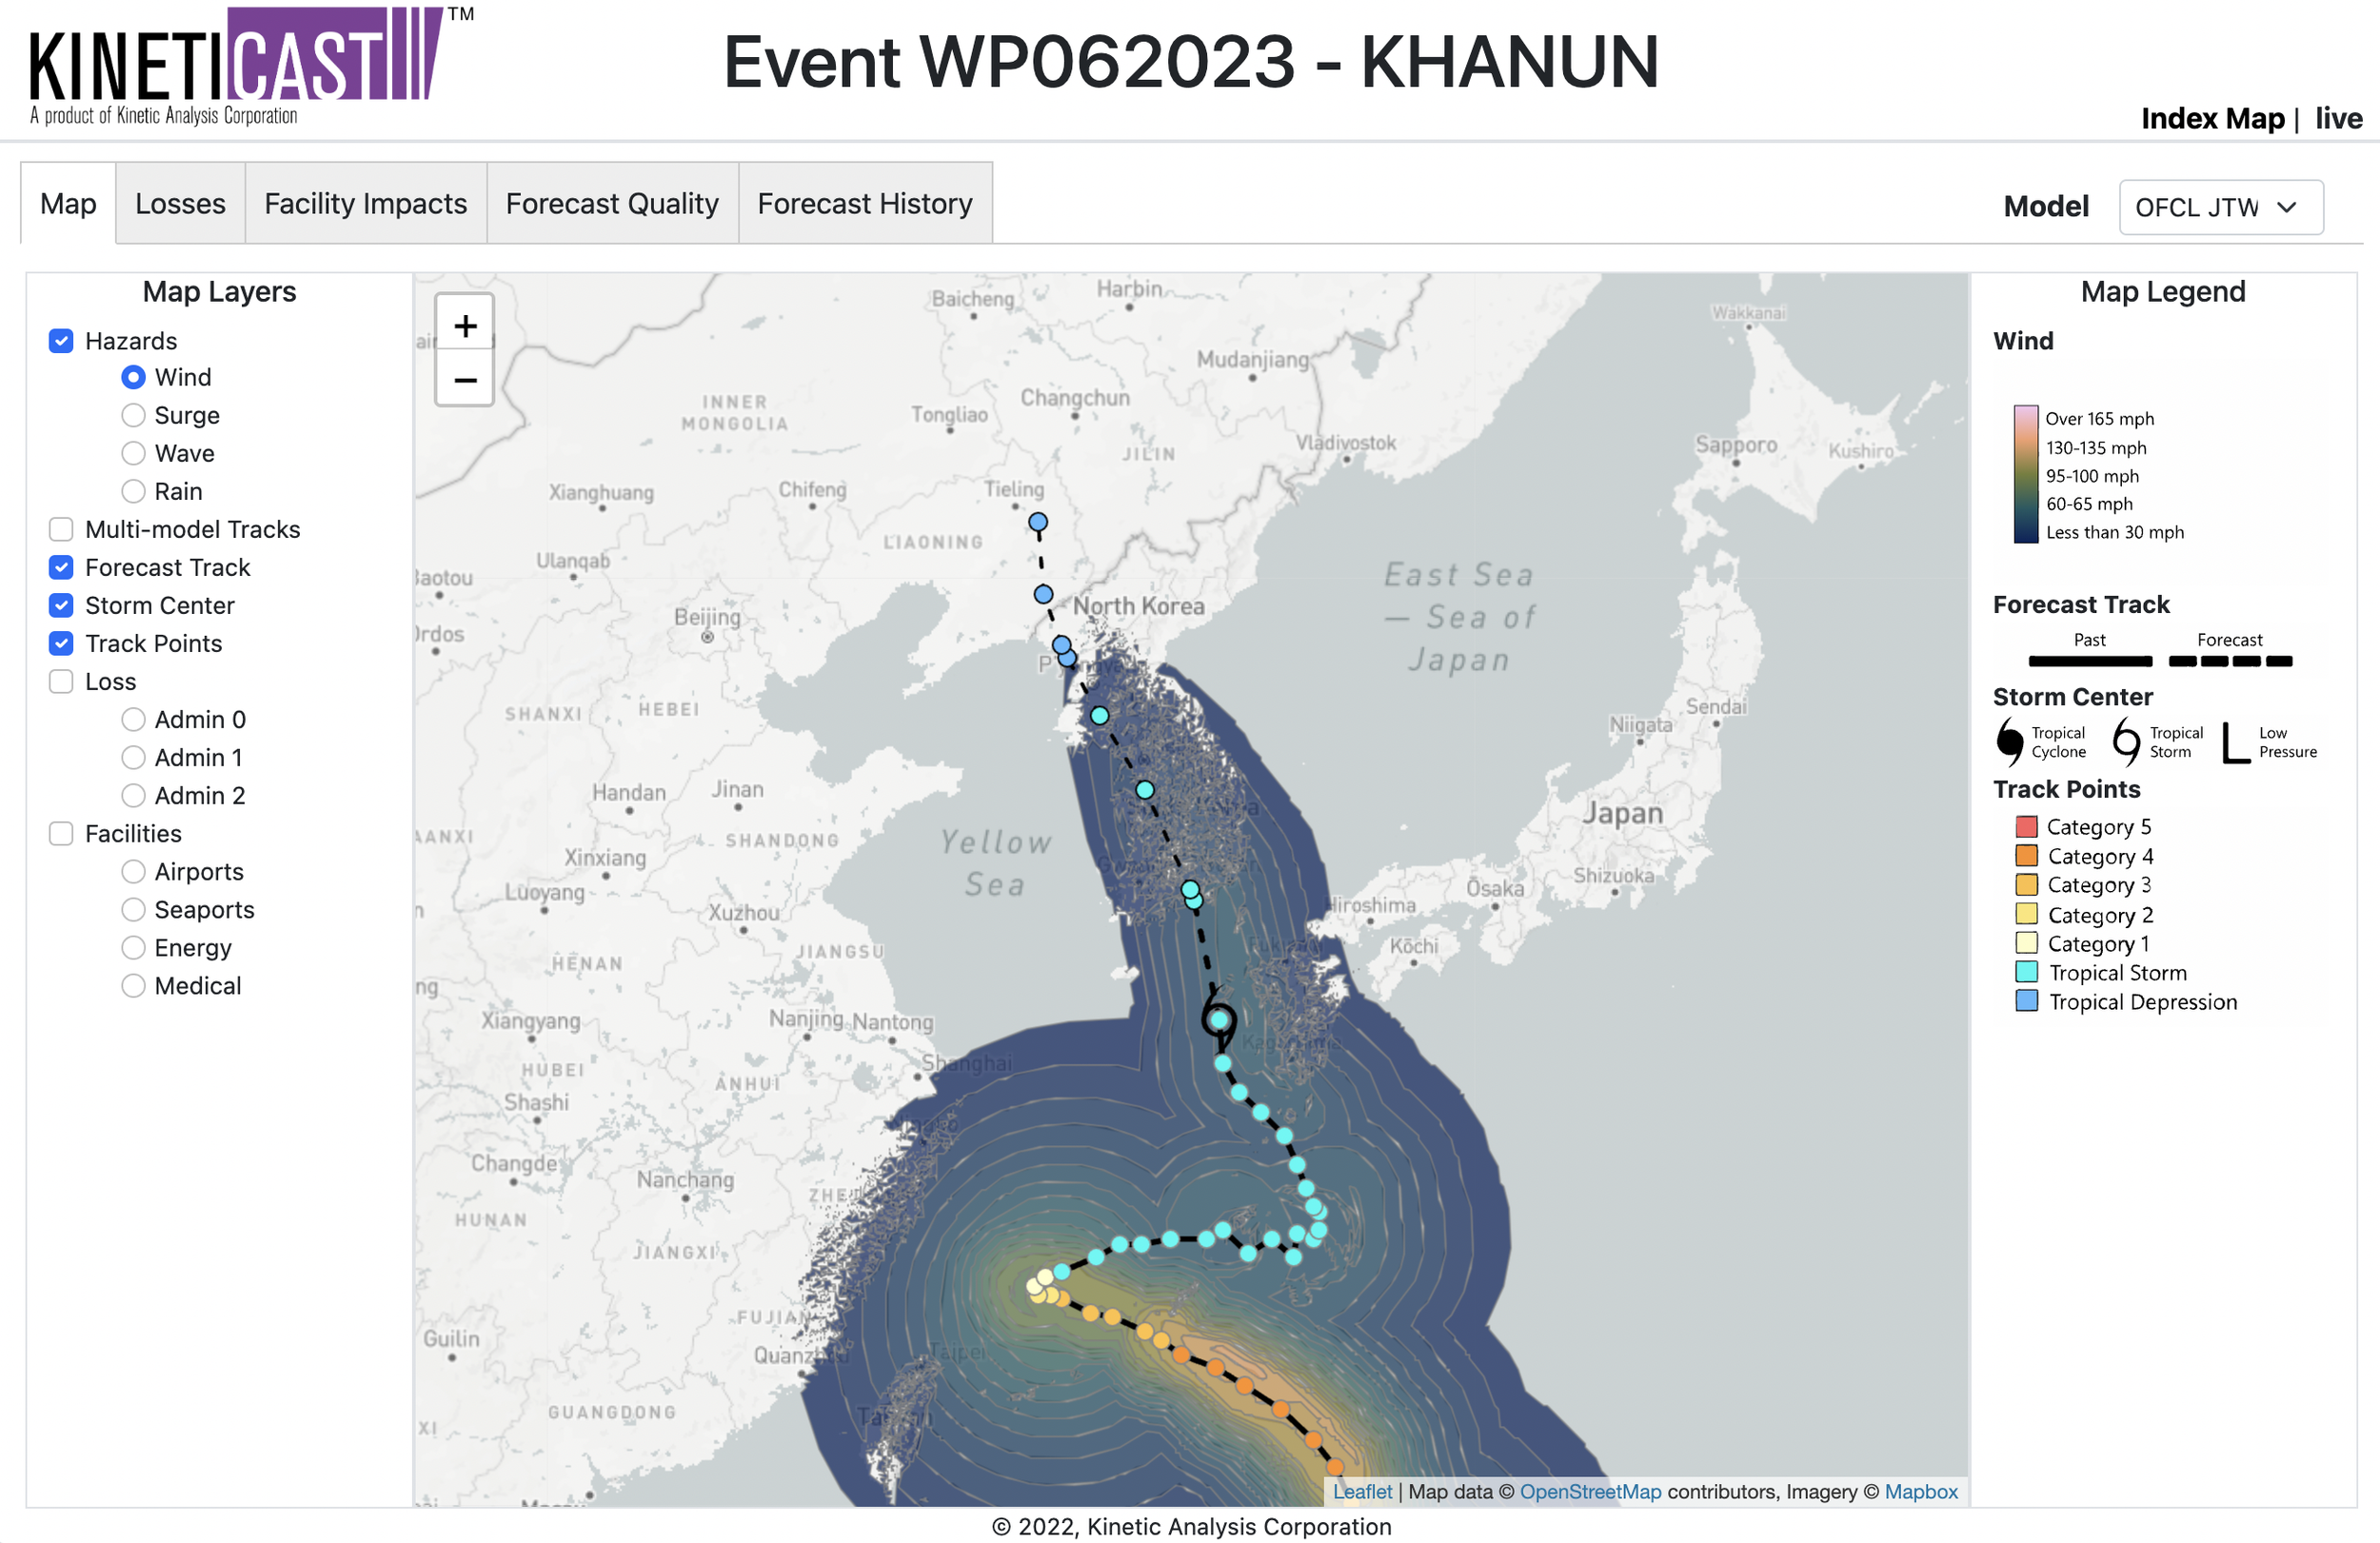
Figure 1: Projected wind swath of Tropical Storm Khanun, generated by KinetiCast™ models using forecast data from the Joint Typhoon Warning Center (JTWC). The solid hurricane symbol denotes the storm position for this forecast. The filled circles are color-coded by intensity. The circles on the dashed line represent the forecast position of the cyclone at 12-hour intervals, and the circles on the solid line depict the past position of the storm at 6-hour intervals.
The forecast graphic from KinetiCast™ shows that Khanun is expected to remain a tropical storm on its approach to the Korean peninsula, although it could get close to regaining typhoon intensity. Fortunately, its forward motion is expected to increase on approach (as denoted by the filled-in circles being spaced further apart in Figure 1). This means that the impacts due to rainfall and flooding may not be as bad as they were in Okinawa and Amami. However, one aspect of the storm to note is its impressive size (Figure 2). The central dense overcast – the largest area of thunderstorms surrounding the center, which in Figure 2 is denoted by the bright white colors – of Tropical Storm Khanun measures over 600 kilometers in diameter! This means that the impacts from heavy rainfall and gusty winds will be spread over a large geographic area. Therefore, the nations of Japan and South Korea should be on alert as Khanun approaches.
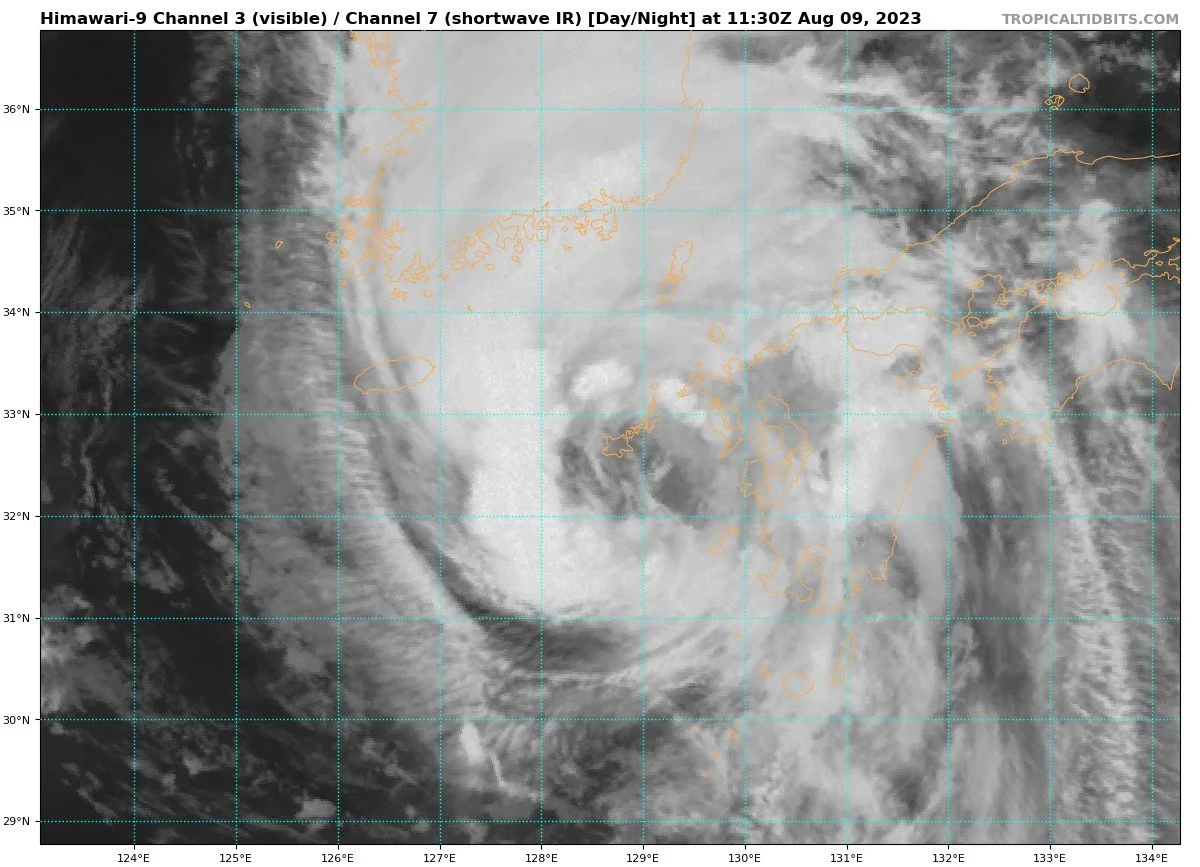
Figure 2: Satellite image of Tropical Storm Khanun using shortwave infrared imagery. Image borrowed from https://www.tropicaltidbits.com/sat/
One aspect of Khanun that is quite unusual is the erratic path it has taken (Figure 1). As we talked about in last week’s blog, Khanun was originally forecast to take a rather straightforward path towards mainland China [3]. Instead, the system stalled significantly before doing so and made a ~180 degree U-turn before making another ~90 degree turn toward the Korean Peninsula. What is the cause of such a haphazard track, and could there be any potential links to climate change?
Firstly, it is very difficult without the aid of advanced computer and numerical models to attribute any one event to climate change [4]. However, we can analyze the factors contributing to Khanun’s erratic path within a broader climate framework. Tropical cyclones are steered by the background atmospheric winds, usually by other areas of high/low pressure [5, 7]. If these low/high pressure systems aren’t sufficiently strong to impart a significant steering flow on the tropical cyclone in question, then the cyclone likely won’t feel the “pull” or “tug” exerted by these background low/high pressure areas [7]. In turn, the cyclone gets “stuck” and follows an erratic course rather than being directed on a consistent path. In the case of Khanun, an area of low pressure was previously forecast to be strong enough to pull the system toward mainland China [6]. However, the low did not follow this script. Instead, the system ended up being much weaker and faster moving than models had initially predicted, and the typhoon found itself in a position where the background atmospheric winds were quite weak. This was the reason why the cyclone spent days meandering near the Okinawa and Amami regions of southern Japan – there just really wasn’t a significant atmospheric push or pull to direct the system on a consistent path. It wasn’t until the steering flow became sufficient again that Khanun was directed north toward a landfall on the Korean peninsula.
I highlight these atmospheric features and the background steering environment because preliminary studies suggest a link between climate change and a slowdown of tropical cyclones worldwide [8, 15]. Large-scale atmospheric winds, known more commonly as the “jet stream,” are a direct result of the difference in temperature between the tropics and the higher latitude regions of the Earth [9]. A well-documented consequence of climate warming is that higher latitude and polar regions are warming much more quickly than tropical and subtropical climates [10]. It then follows that the temperature difference between equatorial and higher-latitude areas must be decreasing with ongoing global warming. The smaller this north-south temperature difference, the weaker the jet stream and overall background winds in the atmosphere [11]. Slower-moving tropical cyclones can have devastating consequences, from the record-breaking rainfall and flooding caused by Hurricane Harvey in 2017 [12] to the near decimation of parts of the Bahamas during Hurricane Dorian [13] in 2019. These are only a few examples of how the slowdown/stalling of tropical cyclones in recent years have completely changed the way we understand and anticipate the impacts from real-time tropical events.
As we have talked about for weeks now, the likelihood of increased tropical cyclone activity continues to ramp up across the globe. The Western Pacific has dominated our attention, but with the historical peak in Atlantic hurricanes occurring around September 10, activity could soon increase there as well [14]. Here at Kinetic Analysis Corporation, we provide you with accurate, near real-time information about a tropical cyclone as it unfolds. We do this by synthesizing information from a variety of sources and translating the meteorological hazards into easily digestible impact information. This includes populations affected by tropical storm/hurricane force winds and storm surge, economic loss and structural damage estimates, and shutdown times for facilities such as airports and seaports. All this information is available in our state-of-the-art web app, KinetiCast™. If you would like more information, please reach out to aagastra@kinanco.com.
References:
1. https://apnews.com/article/japan-typhoon-okinawa-kyushu-66937a14f5d72b079648aa6fbef3cc17
2. https://apnews.com/article/storm-okinawa-rainfall-warnings-weather-japan-khanun-40aa2083f39102a942c2c2cd7f6e9ec0
3. https://www.reuters.com/world/asia-pacific/khanun-forms-china-warns-third-typhoon-three-weeks-2023-07-29/
4. https://news.climate.columbia.edu/2021/10/04/attribution-science-linking-climate-change-to-extreme-weather/
5.https://www.e-education.psu.edu/meteo3/node/2275#:~:text=The%20main%20takeaway%20is%20that,lower%20half%20of%20the%20troposphere.
6. https://www.tropicaltidbits.com/analysis/models/
7. https://www.atmos.albany.edu/daes/atmclasses/atm527/Handouts_files/ChanGray_1982.pdf
8. https://www.climatesignals.org/scientific-reports/global-slowdown-tropical-cyclone-translation-speed
9. https://www.noaa.gov/jetstream/global/jet-stream
10. https://scied.ucar.edu/learning-zone/climate-change-impacts/regional#:~:text=At%20high%20latitudes%2C%20especially,quickly%20as%20the%20global%20average.
11. https://e360.yale.edu/digest/jet-stream-climate-change-heat-wave#:~:text=Scientists%20have%20long%20posited%20that,narrowing%20the%20difference%20in%20temperature.
12. https://www.weather.gov/lch/2017harvey
13. https://www.nhc.noaa.gov/data/tcr/AL052019_Dorian.pdf
14. https://www.nhc.noaa.gov/climo/#:~:text=The%20official%20hurricane%20season%20for,%2DAugust%20and%20mid%2DOctober.
15. https://www.nature.com/articles/s41586-018-0158-3