Who We Are – Kinetic Analysis Corporation
Kinetic Analysis Corporation (KAC) offers you a global, near real-time view of natural hazards and their economic impacts. Our clients include major (re)insurance brokers, weather industries, government agencies, and emergency/risk management organizations.
We currently focus on the winds, storm surge, rainfall, and waves generated by tropical cyclones and the impacts associated with these events. You can access this information directly using our web app, KinetiCast™ (Figures 1 and 2), or through our client portal. KAC is expanding KinetiCast™’s capabilities in 2024 to allow clients to upload their own assets and receive real-time impacts information during an event.
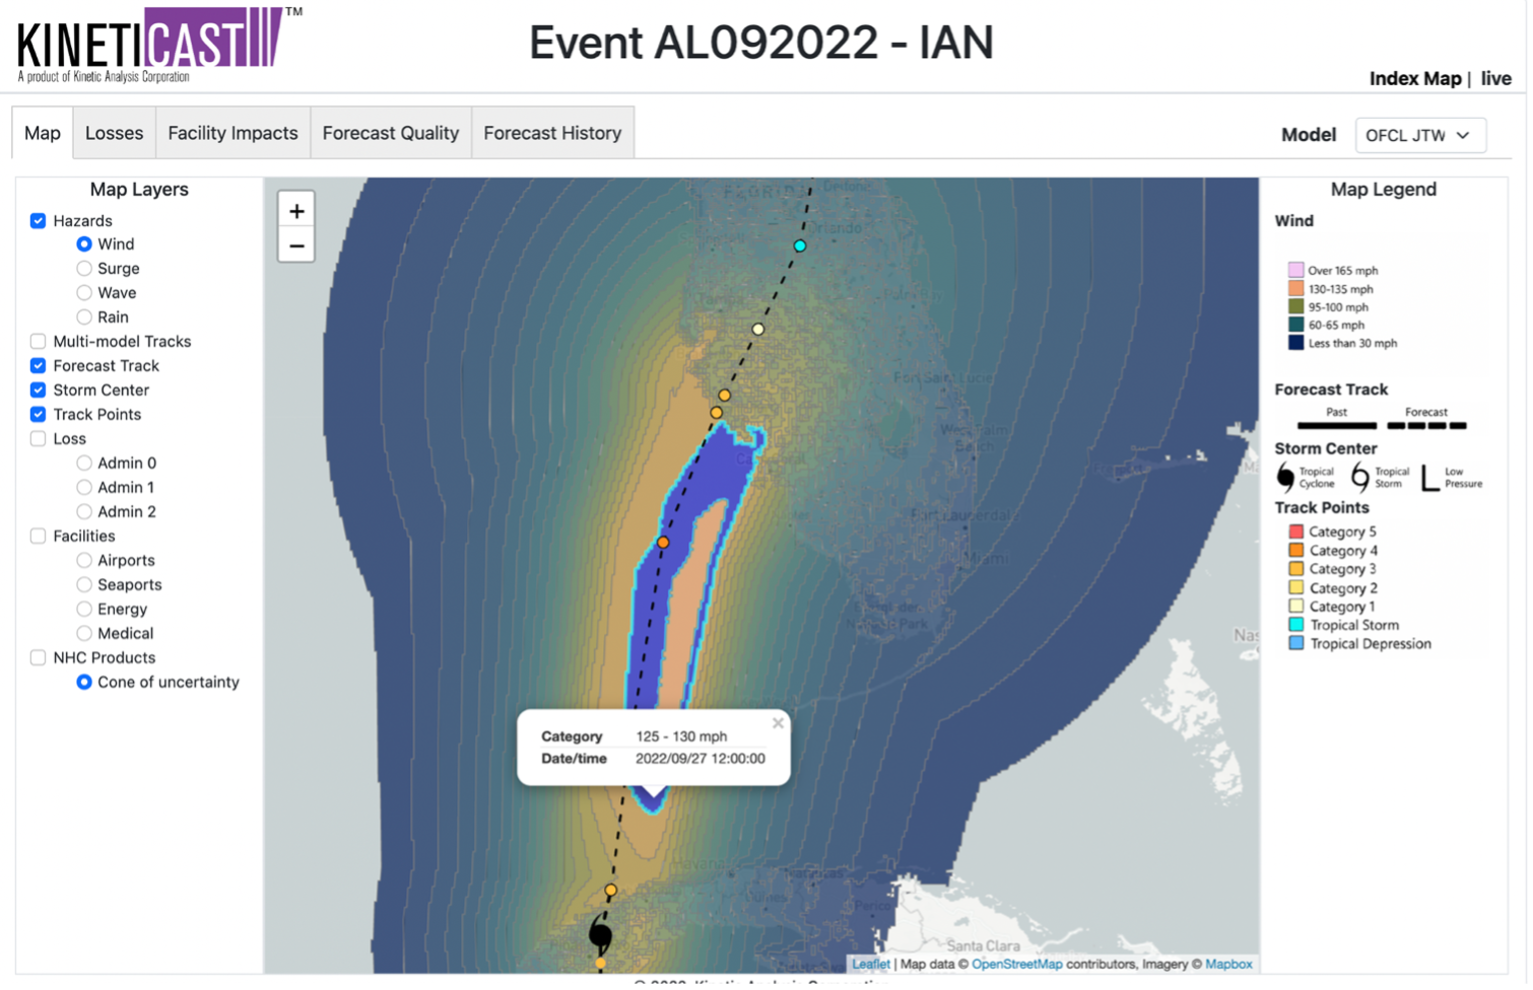
Figure 1: Winds from Hurricane Ian in September of 2022. The dashed line shows the forecast track, and the highlighted blue polygon shows the area where winds are forecast to be in the 125-130 mph range.
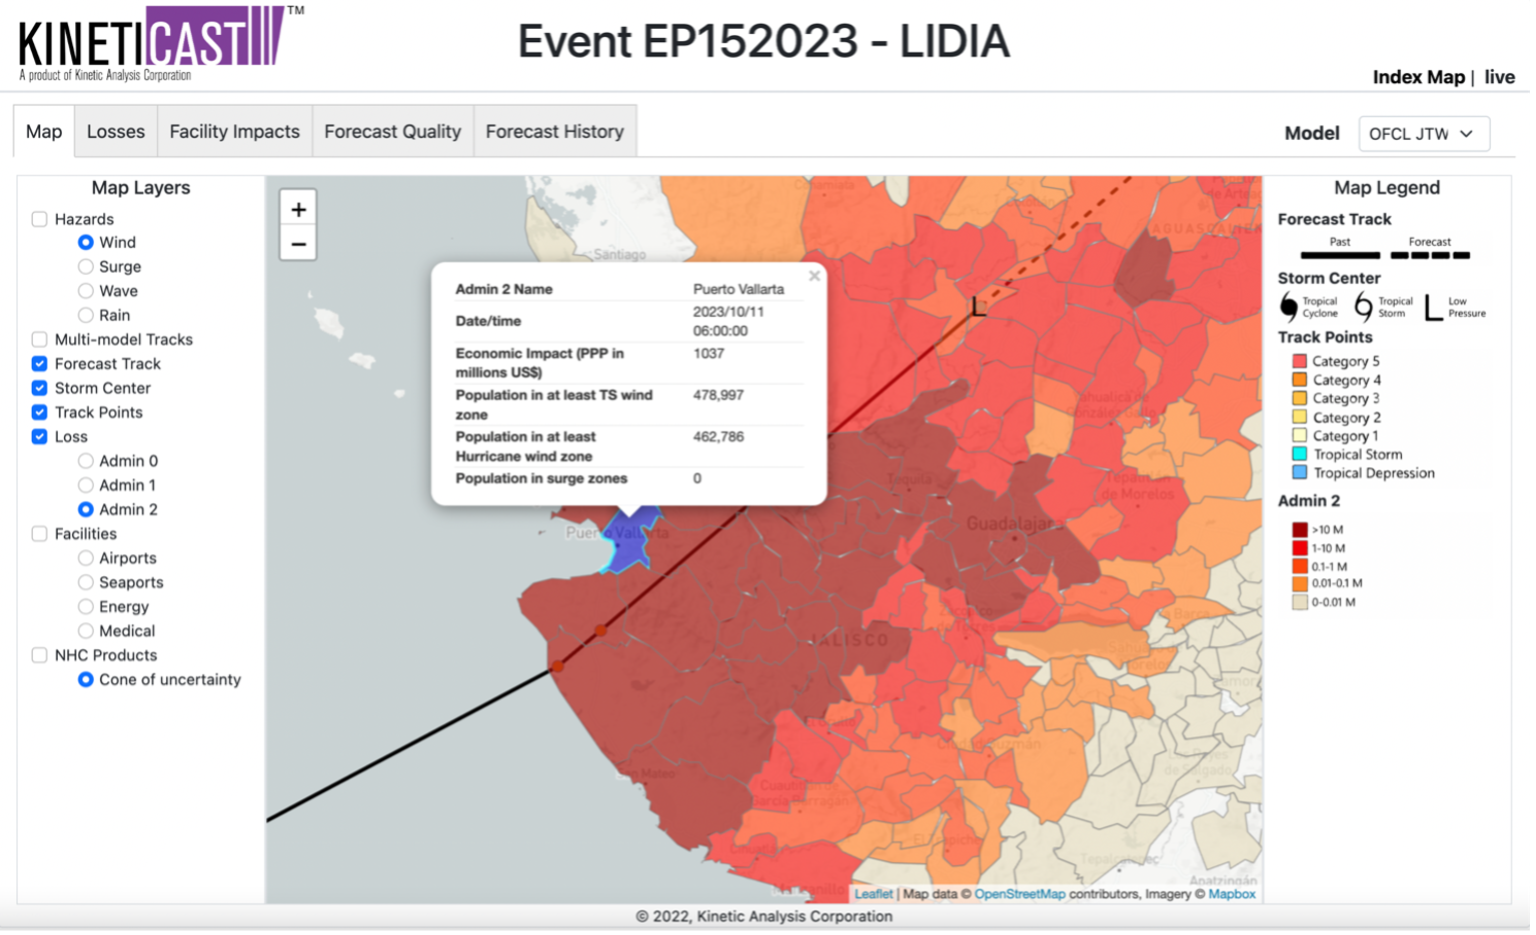
Figure 2: Map of economic impact estimates for Hurricane Lidia (2023) in Mexico. The highlighted blue polygon has been selected to show the potential losses and population impacts for Puerto Vallarta, Mexico.
KAC’s services extend beyond its real-time products. We help clients with projects that quantify their risk and improve their disaster response. An example is our work with the African Risk Capacity where we created a tropical cyclone risk model for the Southwest Indian Ocean. This involved generating exposure data and modeling the hazard layers and economic impacts caused by historical tropical cyclones and synthetic tropical cyclones in a 10,000-year stochastic catalog. The risk model is used as the foundation of parametric insurance products.
For other clients we have generated thousands of updated, quality-controlled hazard layers for historical and real-time tropical cyclones based on a cyclone’s position, intensity, size, and asymmetry as provided by forecast centers worldwide. The hazard data include wind, waves, surge, and rain at varying spatial resolutions and in various data formats. These data can be used to generate exceedance probability curves and return periods (Figure 3) and support the creation of parametric insurance products.

Figure 3: 25-year return period map of wind speeds from tropical cyclones in two regions: (top) the Gulf of Mexico and western Atlantic and (bottom) the southwest Indian Ocean and southeastern coastline of Africa. The winds shown in the top figure are based on National Hurricane Center best-track data for tropical cyclones that occurred from 1950-2021. The winds shown in the bottom figure are based on Joint Typhoon Warning Center best-track data for tropical cyclones that occurred from 1980-2021. The winds represent terrain-adjusted, 1-minute sustained winds at 10-meter elevation.
Kinetic Analysis works constantly to enhance our modeling capabilities and real-time data feeds. Our new version of KinetiCastTM can send alerts when your assets anywhere in the world are forecast to be affected by a tropical cyclone, and estimate evacuation, shut-down, and recovery times, and forecast economic impacts. A detailed description of our data offerings is available on our website (www.kinanco.com) under the “Products” tab. Act now to be one of the first to have access; reach out to us at aagastra@kinanco.com.
