The Three Pillars of Risk Modeling: Part 3
The Social Aspects of Exposure and Vulnerability
We have discussed the more traditional, mathematical framework of vulnerability, but vulnerability inherently includes social aspects that can either amplify or dampen the impacts from a hazard [1]. Thus, in order to effectively manage risk, it is critical to understand how vulnerability is created and the factors that cause it to increase.
A more contemporary approach for defining vulnerability is that “society, in its interaction with the changing physical world, constructs disaster risk by transforming physical events into hazards of different intensities or magnitudes through social processes that increase the exposure and vulnerability of population groups, their livelihoods, production, support infrastructure, and services” [1]. The social aspects that influence the exposure and vulnerability that contribute to the level of risk experienced by individuals, families, and communities are complex and multitudinous. For detailed information, the reports by the Intergovernmental Panel on Climate Change provide useful summaries. See, for example [1].
Because vulnerability inherently includes the social component of risk, vulnerable groups are not only at risk because they are exposed to a hazard. Vulnerable groups can be at even greater risk as a result of marginality, everday patterns of social interaction and organization, and an access (or lack thereof) of resources [1]. Thus, the effects of a disaster on a particular household result from a complex set of drivers and interrelated conditions. Global processes underlying vulnerability include population growth, rapid and inefficient urban development, international financial pressures, increases in socioeconomic inequality, trends and failures in governance, and environmental alteration/destruction [1, 2, 3, 4, 5]. An example of the spatial variability of these factors is the distribution of socially vulnerable groups in the United States based on four measures: low income, % minority (persons of color), % without a high school diploma, and % 65 and older (Figure 1) [6].

Figure 1: Distribution of socially vulnerable populations by census tract. Data from the U.S. Census Bureau’s 2014-2018 American Community Survey. Graphic borrowed from: https://www.epa.gov/system/files/documents/2021-09/climate-vulnerability_september-2021_508.pdf
Due to different conceptual frameworks and ways of understanding vulnerability, approaches to address the root causes of vulnerability also differ [1]. Some of these approaches emphasize the social conditions and root causes of exposure as being more important than the hazard in generating unsafe conditions [1, 7]. Others highlight the need to focus on coupled human-environmental systems and the ability of societies to transform nature and the environment, while also focusing on the feedbacks between the two [1, 8, 9]. Lastly, there is the framework outlined in the Intergovernmental Panel on Climate Change (IPCC) Fourth Assessment Report, which describes vulnerability as a function of exposure, sensitivity, and the ability of communities to adapt to ongoing climate change [1, 10]. This view also differs in its approach by focusing on long-term trends and environmental stressors [1, 10].
An example of the levels of U.S. climate vulnerability based on a combination of environmental, social, economic, and infrastructure effects on neighborhood-level stability is shown in Figure 2 [11]. The datasuggests that portions of the American South and Southwest are more vulnerable to the effects of climate and climate change when compared to parts of the Upper Midwest and Northeast. This is likely due to some of the factors in Figure 1 that would suggest higher levels of vulnerability in the U.S. Sunbelt, including a higher percentage of people of color and those without a high school diploma.

Figure 2: Map of overall climate variability based on environmental, social, economic, and infrastructure effects. The darker green and blue colors indicate U.S. counties that are more vulnerable to the effects of climate and climate change. Map borrowed from: https://map.climatevulnerabilityindex.org/map/cvi_overall/usa?mapBoundaries=Tract&mapFilter=0&reportBoundaries=Tract&geoContext=State.
Overall, there is high confidence among the disaster community that although extreme events are usually considered the cause of disaster risk, vulnerability and exposure are the key factors that determine the magnitude of an events impacts [1]. Thus, it is critical to provide exposure/vulnerability information in order to fully diagnose the risk from a natural event.
Kinetic Analysis provides an assessment of the human component of exposure and vulnerability for each active event. This information is encapsulated in our web app, KinetiCastTM, and includes information such as populations affected by wind and storm surge, impacts to facilities (including shutdown times and downtimes), and evacuation times. A sample of this information for Hurricane Idalia in 2023 is shown in Figures 3, 4, and 5.
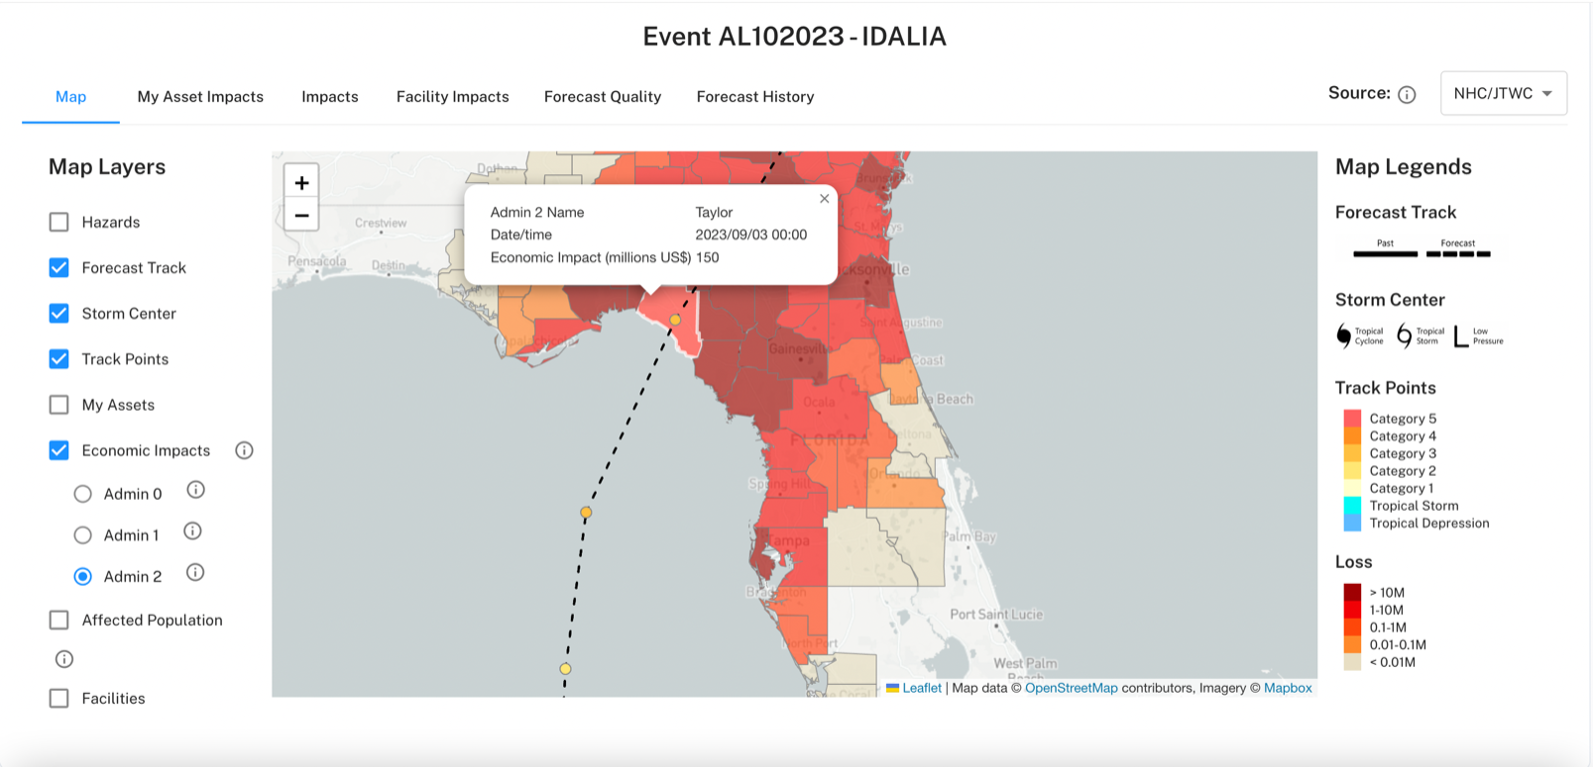
Figure 3: Economic impacts for Hurricane Idalia (2023) as displayed in KinetiCastTM at the Admin 2 level (in the USA, this would be the equivalent of counties).

Figure 4: Affected populations from tropical storm-force winds, hurricane force winds, and storm surge during Hurricane Idalia (2023) as displayed in KinetiCastTM at the Admin 2 or country level.

Figure 5: Facility impacts information for Hurricane Idalia (2023) as displayed in KinetiCastTM. The information includes the facility name, the structural economic impact, the economic impact of the contents inside the structure, the start time for this impact (equivalent to the onset of tropical storm-force winds), and the total recovery time in days. KinetiCastTM allows one to search for a specific facility in table format or view the facility and the associated impacts on a map (Figure 6).
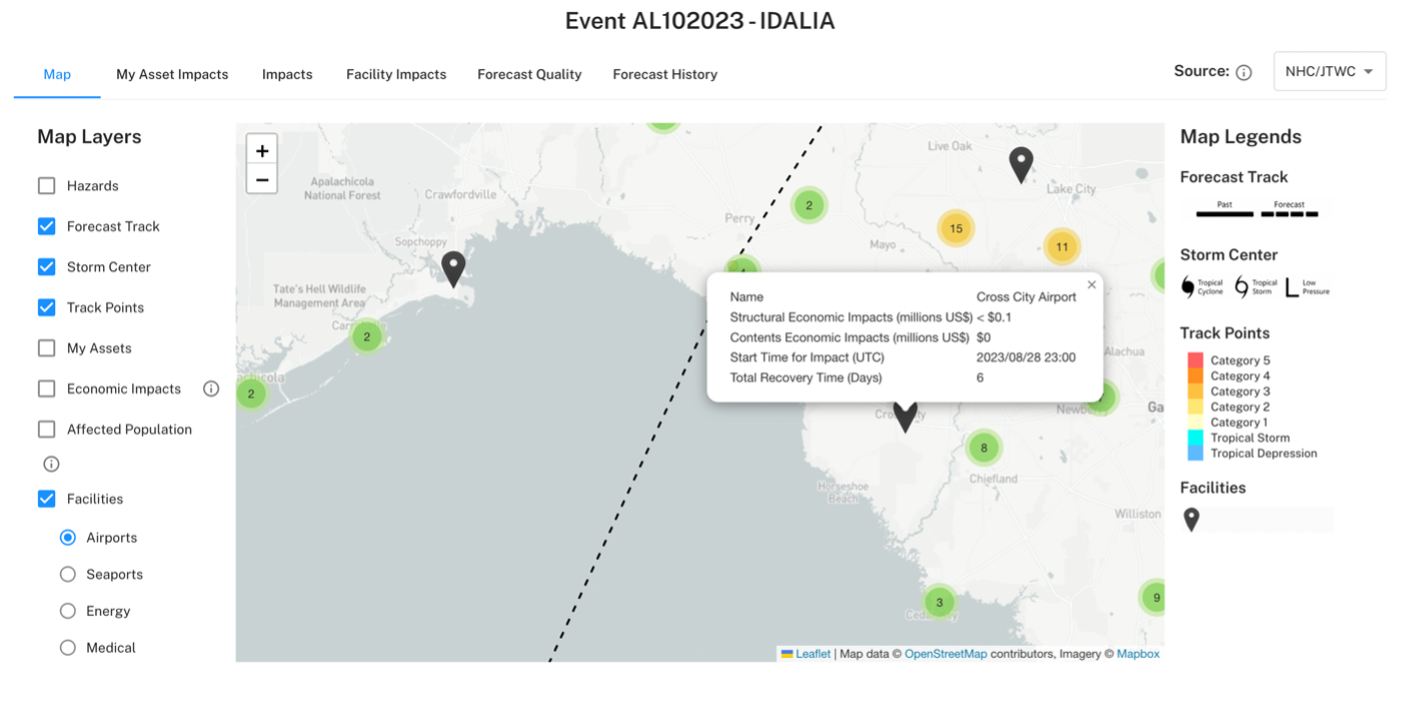
Figure 6: Zoomed-in view of facility impacts in map form for Hurricane Idalia. The popup shown is prompted when a user clicks on that location and shows the associated economic impacts, start time for impact, and total recovery time.
The type of forecasting that we have outlined here, which synthesizes the hazard, exposure, and vulnerability to provide a detailed view of the impacts, can be thought of as a version of impact-based forecasting [12]. This type of forecasting is critical for assessing risk and supporting decision making, with the ultimate goal of encouraging early action that mitigates damage and loss of life from natural hazards [12]. Here at Kinetic Analysis Corporation, we take great pride in being able to provide you with the most up-to-date, real-time impacts information for a tropical cyclone anywhere in the world. If you would like more information about our products and services, please reach out at aagastra@kinanco.com.
References
1. https://www.ipcc.ch/site/assets/uploads/2018/03/SREX_Full_Report-1.pdf
2. https://www.researchgate.net/publication/259073004_Climate_Variability_Climate_Change_and_Social_Vulnerability_in_the_Semi-arid_Tropics
3. https://www.researchgate.net/publication/259571253_Pelling_M_2003_The_vulnerability_of_cities_natural_disasters_and_social_resilience_Earthscan_London
4. https://www.researchgate.net/publication/279957325_Vulnerability_analysis_livelihoods_and_disasters
5. https://www.scirp.org/reference/referencespapers?referenceid=1838992
6. https://www.epa.gov/system/files/documents/2021-09/climate-vulnerability_september-2021_508.pdf
7. https://www.preventionweb.net/files/670_72351.pdf
8. https://www.ilankelman.org/miscellany/hewittetal.1971.pdf
9. https://groups.nceas.ucsb.edu/sustainability-science/2010%20weekly-sessions/session-3-09.27.2010/supplemental-readings-from-princeton-group/Turner%20et%202003%20Vulnerability%20framework.pdf/at_download/file
10. https://www.ipcc.ch/site/assets/uploads/2018/05/ar4_wg1_full_report-1.pdf
11. https://map.climatevulnerabilityindex.org/map/cvi_overall/usa?mapBoundaries=Tract&mapFilter=0&reportBoundaries=Tract&geoContext=State
12. https://www.unescap.org/sites/default/d8files/knowledge-products/IBFWS%20Manual_FINAL.pdf