Kinetic Analysis Corporation Attends Disasters Expo in Miami
Last month, we attended the annual Disasters Expo at the Miami Beach Convention Center. The Disasters Expo is a two-day event featuring disaster and emergency response professionals as well as the latest solutions and technologies in disaster management [1].
Kinetic Analysis had a booth at the Disaster Expo where we provided live demonstrations of KinetiCast™, our newly updated web app. KinetiCastTM provides users with an assessment of a tropical cyclone’s physical hazards (wind, storm surge, waves, and rain) and impacts (economic loss, facility impacts, shutdown/evacuation times) for locations that matter to them. We do this by providing you with a highly detailed view (down to a <2 km resolution) of the hazards that are updated in real-time as new forecasts are released.
In addition, we recently implemented a new capability that allows users to upload their data into our web app. This data could be any properties or assets of interest, along with the construction type and an estimated structure/contents value. Whenever these assets are forecast to be affected during a real-time tropical event (tropical storm or hurricane), the user that uploaded them will receive an email notification as far out as 5 days in advance, with information such as the economic loss to the structure and its contents, the estimated start time for shutdown/evacuation, and the downtime of the structure in days. An example of this capability in our web app is shown in Figure 1. Figure 2 shows what an email notification to the user might look like.
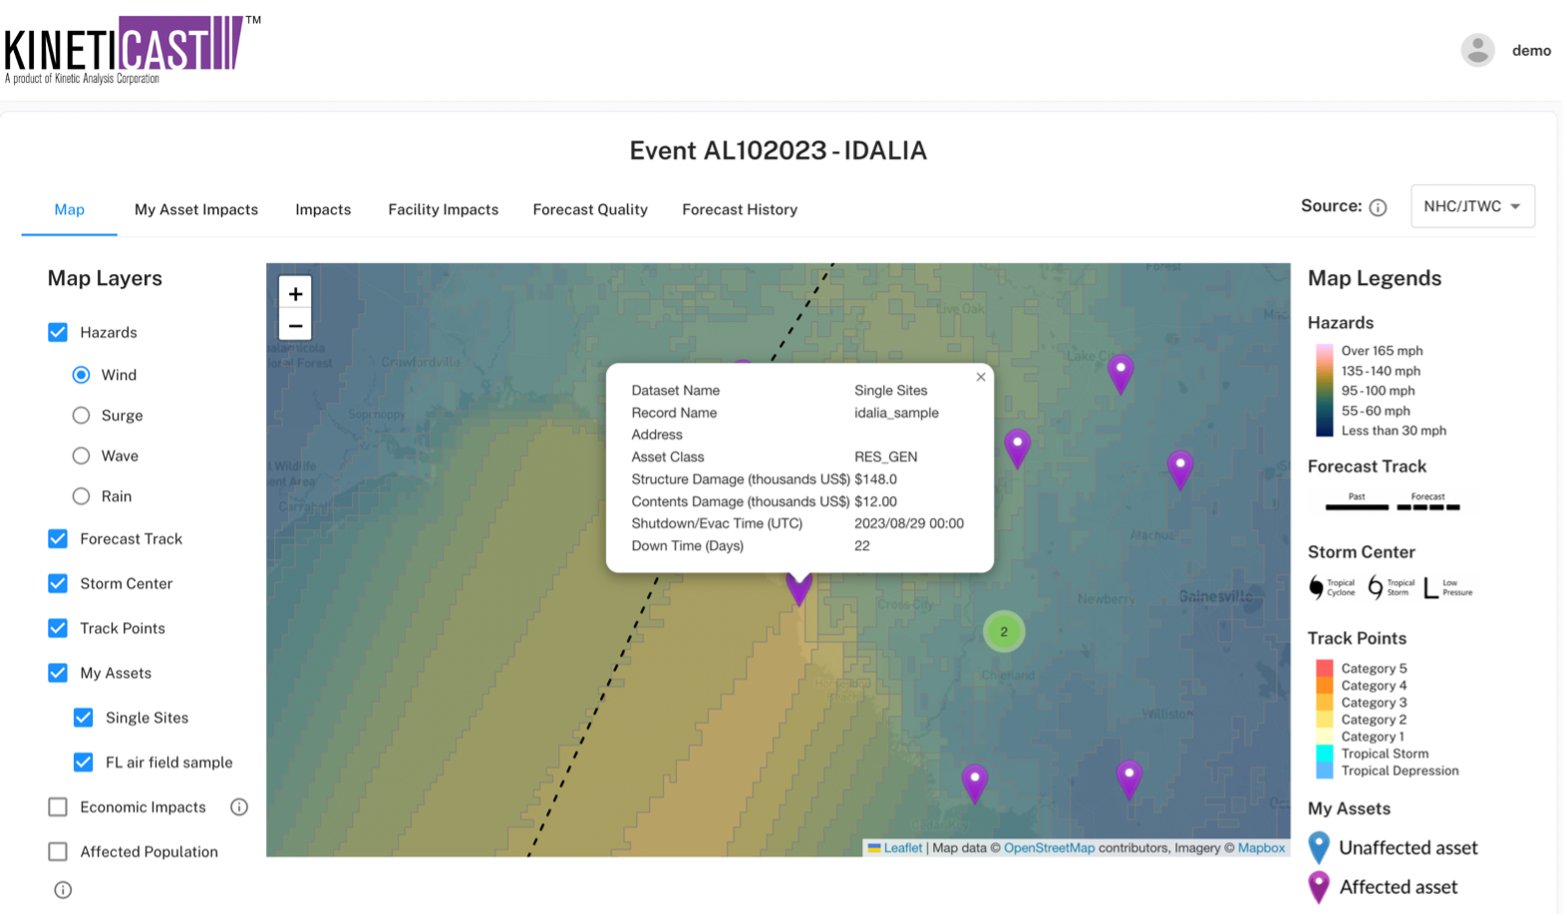
Figure 1: Example of an impacted site that a user has uploaded into KinetiCast™. The highlighting in purple indicates the asset is affected by the real-time event. Clicking on the asset shows the name the user uploaded, the asset class or type of construction, the structure/contents damage in thousands of USD, the start time for shutdown/evacuation for said structure (usually equivalent to the onset of tropical storm-force winds), and the downtime of the structure in days.

Figure 2: An example of what an email alert to the user would display whenever one or more of their assets is expected to be affected.
You might be wondering just what exactly makes our data so unique. Why should you care about our data when the National Hurricane Center is providing updates and issuing watches/warnings in real-time? There are several reasons.
For one, the National Hurricane Center (NHC) offers forecasts in terms of broad categories such as winds above tropical storm or hurricane force. In addition, the wind maps produced by NHC assume the winds are occurring over open (flat) terrain. But we know that topographical features such as mountains and different classes of land use can affect the intensity and nature of winds. Kinetic Analysis’s forecasts accounts for the influence of factors such as topography and land use. Kinetic Analysis also provides estimates of cumulative rain, significant wave heights, and storm surge consistent with NHC forecasts.
Given the uncertainty in forecasts, particularly for hurricane intensity, our hazard and impact products allow for a qualitative assessment of the uncertainty associated with a tropical event. Users can view the products for different models (such as the GFS and European) to see data about how each model is performing for that event (the forecast quality). This eliminates the need for someone with a meteorologist or GIS background to provide guidance as an event unfolds. Figure 3 shows an example of how a user might toggle on a different forecast by going to the “Source” tab within KinetiCast™. Figure 4 displays the “Forecast Quality” tab in the app. The location and distance of the points from the center of the circles represents the error in forecasts. The colors indicate the day since the storm was designated a tropical storm. The closer a shaded point is to the center of the circular (radar) plots, the smaller the error in the forecast track. For the example of Hurricane Idalia in Figure 4, we can see that model guidance from the AVNO (GFS or American model) was best at predicting the location of the storm with a 1 day lead time.

Figure 3: The “Source” tab (top right) allows a user in KinetiCast™ to display the forecast for a given storm for any of the global models/forecasting agencies.

Figure 4: The “Forecast Quality” tab in KinetiCast™ allows a user to compare the skill among the major models and the official (OFCL) forecast from the National Hurricane Center in North America or the Joint Typhoon Warning Center in the Western Pacific/Indian Oceans. The concentric circles represent average forecast track errors. The shaded colors represent the day since the storm was designated. The closer a shaded point is to the center of the circular (radar) plots, the lower the average track error was for that day. The lead time can also be changed, which is the forecast out to a certain number of days (1, 3, or 5 in our web app).
KinetiCast™ is an annual subscription web app and has multiple pricing plans available depending on the needs of a specific user. The different tiers, their pricing, and available features are summarized in Figure 5.
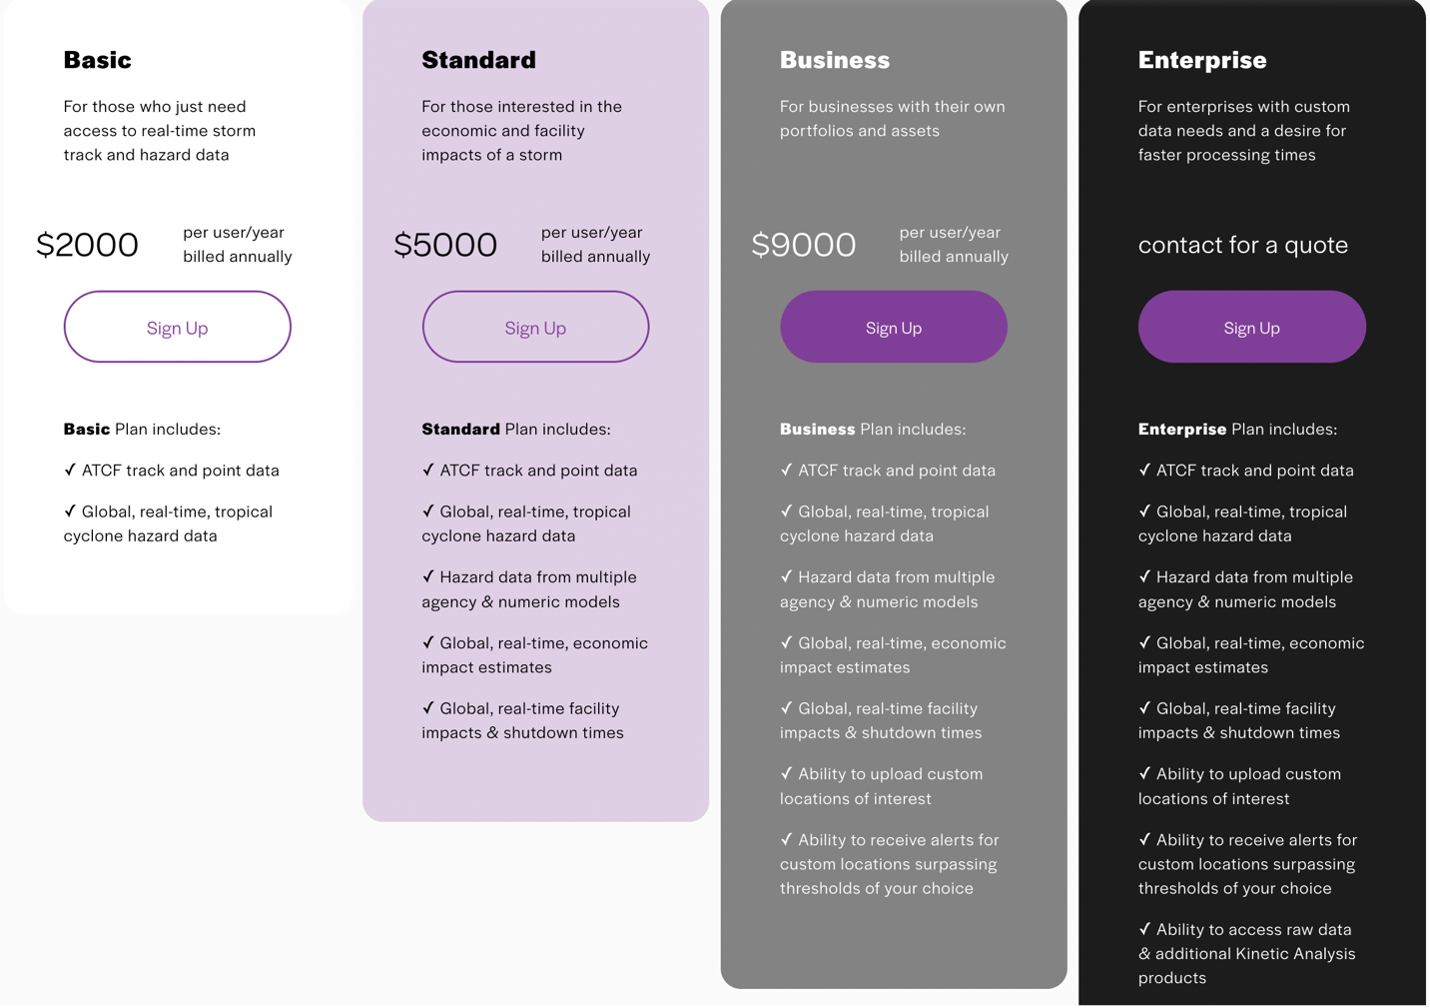
Figure 5: KinetiCast™ pricing plans and available features that come with each plan. https://www.kinanco.com/kineticast-pricing.
There is so much more to what we offer beyond KinetiCast™, though. We have also provided custom risk modeling to several clients in the past, including providing historical and stochastic tropical cyclone events/return periods for managing and understanding risk. Kinetic Analysis also produces risk assessments and real-time impact information to support a wide range of parametric insurance types using triggers based on modeled hazard (tropical cyclone wind and/or storm surge), damage (tropical cyclone wind and wave) and/or modeled loss.Kinetic Analysis is the tropical cyclone model and data provider for the African Risk Capacity (ARC). A full description of our data offerings can be found at our website https://www.kinanco.com/ under the “Products” tab.
References
1. https://www.disasterexpomiami.com/