
A Deeper Dive into Kinetic Analysis Corporation’s Exposure Modeling
Introduction
In the past, we have written about Kinetic Analysis Corporation’s (KAC) hazard modeling framework (see here). However, thus far we have spent less time outlining our exposure modeling. From our previous blogs, you may recall that while hazard is typically considered the cause of disaster risk, vulnerability and exposure are also key determining factors [1]. Thus, it is critical that we give an overview of our approach on these two ideas.
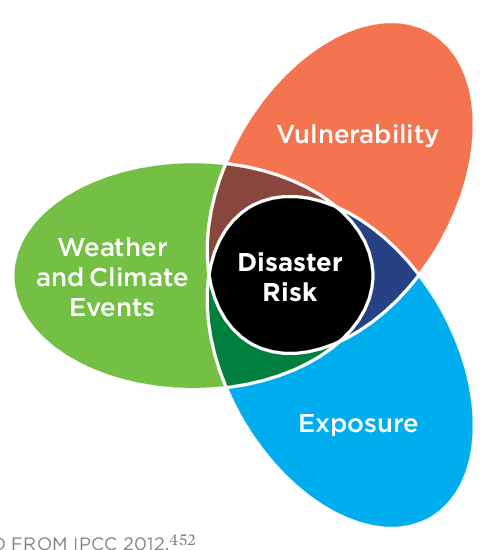
Disaster risk can be thought of as an interplay between the physical hazards induced by weather and climate events, the exposure or populations impacted, and the vulnerability of said populations.
Image borrowed from: https://www.researchgate.net/figure/Factors-That-Influence-Risk-Include-Exposure-Vulnerability-and-Hazards_fig2_282613252.
KAC’s basic exposure system encompasses eight classes of the vulnerable infrastructure, otherwise known as exposure in insurance terminology, using different economic estimates, land use/land cover, and population distribution techniques. The primary purpose of these exposure datasets is not necessarily to create an accurate valuation of the exposures on the ground. Instead, they are designed to give realistic economic impact estimates across a wide variety of economies, infrastructures, etc., when used with the hazard model and damage estimation code. This blog post will describe the data sources, algorithms, and verification process used for KAC’s basic exposure system. First, the basic exposure and classification system will be outlined, followed by the most common geographic data sources used. Next the exposure models and data sources are elaborated on. Lastly, the damage model is described along with verification tests using KAC’s tropical cyclone model simulations of major, fairly well documented historical events.
Basic Exposure System and Datasets
The basic exposure system classifies each grid cell into one of eight possible exposure categories and allocates an economic value to that cell. This classification is based on land use/land cover type, population density, and economic considerations. The available categories are agriculture, low density populated, medium density populated, high density populated or industrial, as well as the previous four categories but for a low-income classification.
One of the most vital elements in creating a proper risk analysis are the underlying geographic data. KAC uses either the Global Administrative Areas project (GADM) or GeoNames databases for county and administrative names and boundaries. Annual updates to these geographic datasets are loaded into our database every winter and are used as the framework for the exposure system. The country boundaries and available level 1 and level 2 administrative regions are exported as raster (gridded) data files at the same resolution as the underlying population and land cover data sets to support the exposure system.
The second key geographic dataset is population. Two population datasets are available. The first is the NASA Global Population of the World Version 4 (NASA SEDAC) [2], which is used for the 30 arcsecond based models. The other population dataset is the 100 meter or 3 arcsecond grid WorldPop constrained demographic datasets [3, 4]. The third key geographic information is land use/land cover. KAC uses two datasets for this as well: (1) the current NOAA VIIRS Surface Type dataset [5], which is at a resolution of 15 arcseconds and (2) the UNFAO Global Land Cover dataset (provided at 30 arcsecond resolution) [6].
Exposure Models
Several different exposure datasets are available within KAC’s internal database. In this blog, we will focus on the one most commonly used for KAC economic loss generation: the Enki Economic Dataset. The Enki Economic Dataset uses a common economic dataset derived from various publicly available data sources to create infrastructure valuations. The initial source and structure for country level economic data is the CIA World Factbook [7]. The CIA World Factbook contains basic economic data by country, including GDP in current US Dollars (Real GDP), GDP Per Capita Purchasing Power Parity (GDP PC PPP), and breakdowns by sector of origin including agriculture, industry, and services. These data have the advantage of being organized into a single source and thus a consistent framework upon which to build. For subnational level data, a variety of sources are used to modify the estimated Real GDP and GDP PC PPP at the level one and level two administrative areas (county equivalent). These sources range from authoritative (such as the US Bureau of Economic Analysis) to datasets compiled by multinational organizations (such as the Organization for Security and Cooperation in Europe, World Bank, and the International Monetary Fund). KAC can also use an exposure model which uses a global subregional GDP dataset created by the World Bank as the economic baseline. However, as mentioned above, the Enki Economic Dataset is most commonly used to generate our loss estimates.
Damage Estimation and Calculation
Once the hazards for a given storm have been modeled, KAC’s damage scripts will scan the hazard data and compute damage ratios expected to be experienced by any exposures falling within the footprint of the hazard layer. A damage ratio is a value between 0 and 1 that describes the fraction of the structure expected to incur damage [8]. The program makes no distinction or adjustments between the various input exposure datasets. Damage curves for wind and water are derived from a power function based on wind speed and the type of exposure. This means that the damage ratios are expected to increase at a highly nonlinear rate beyond a certain wind speed. The output of the damage model is a SQL compatible file that has damage ratio estimates for each exposure point within the hazard footprint.
Model Validation
The combined KAC exposure system, damage model, and hazard generation system has been verified against 35 tropical cyclone events with reasonably detailed damage estimates worldwide. The correlation between reported and computed economic impacts for these 35 tropical cyclones was 0.95 (Figure 1). The correlation would be higher if not for a single outlier: Hurricane Sandy, which was considerably underestimated.
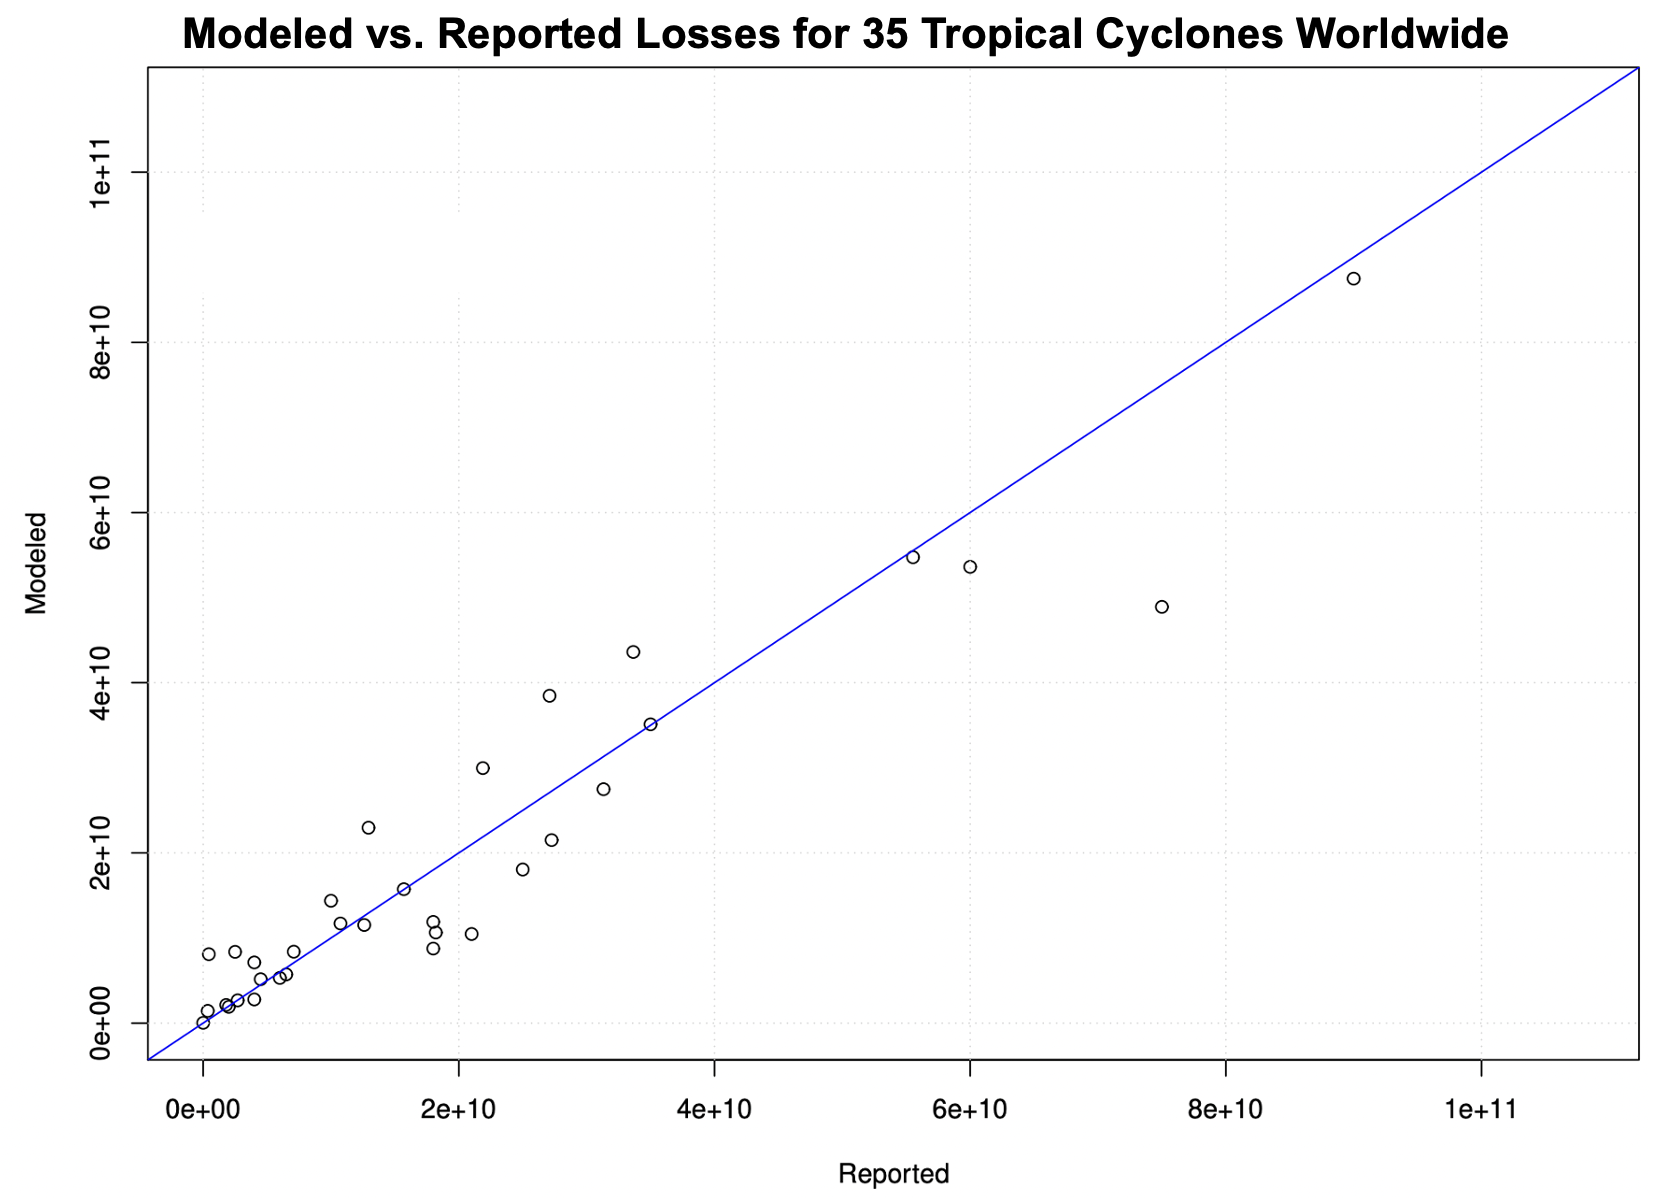
Figure 1: Scatterplot of modeled vs. reported losses for 35 tropical cyclone events with reasonably detailed damage estimates worldwide. The modeled losses are based on the default KAC exposure system, damage model, and hazard generation system. The correlation coefficient for this relationship is 0.95.
We hope that this blog provides a more detailed overview on our exposure modeling. In a future blog post, we plan to provide some further information on our modeling capabilities, including the modeling of vulnerability.
References
1. https://www.ipcc.ch/site/assets/uploads/2018/03/SREX_Full_Report-1.pdf
2. https://doi.org/10.1371/journal.pone.0107042
3. https://doi.org/10.1371/journal.pone.0107042
4. https://www.worldpop.org/
5. https://doi.org/10.1080/2150704X.2015.1101649
6. https://www.fao.org/land-water/land/land-governance/land-resources-planning-toolbox/category/details/en/c/1036355/
7. https://www.cia.gov/library/publications/resources/the-world-factbook/index.html
8. https://www.verisk.com/insurance/visualize/modeling-fundamentals-anatomy-of-a-damage-function/#:~:text=Introduction,to%20rebuild%20the%20entire%20structure).